Spatial Tx: ingest 10x Visium sample data
Download sample data from https://cf.10xgenomics.com/samples/spatial-exp/2.1.0/CytAssist_FFPE_Protein_Expression_Human_Glioblastoma
Ingest into spatial SOMA
Read from SOMA, inspect/plot data
WARNING Spatial support is experimental and under active development. There will likely be breaking changes to both the storage format and API.
[1]:
import shlex
from functools import partial
from os import makedirs, remove
from os.path import exists, join
from shutil import rmtree
from subprocess import check_call
from sys import stderr

import matplotlib.patches as mplp
import matplotlib.pyplot as plt
import numpy as np
import scanpy as sc
from matplotlib.collections import PatchCollection

import tiledbsoma
from tiledbsoma import Experiment
from tiledbsoma.io.spatial import from_visium

err = partial(print, file=stderr)
/home/jules/.pyenv/versions/3.12.7/envs/soma/lib/python3.12/site-packages/dask/dataframe/__init__.py:31: FutureWarning: The legacy Dask DataFrame implementation is deprecated and will be removed in a future version. Set the configuration option `dataframe.query-planning` to `True` or None to enable the new Dask Dataframe implementation and silence this warning.
  warnings.warn(
Papermill parameters:
[2]:
# 10x visium sample data paths to download; will be skipped if already present locally, unless `overwrite`
url_base = 'https://cf.10xgenomics.com/samples/spatial-exp/2.1.0'
dataset_name = 'CytAssist_FFPE_Protein_Expression_Human_Glioblastoma'
filtered_h5 = 'CytAssist_FFPE_Protein_Expression_Human_Glioblastoma_filtered_feature_bc_matrix.h5'
spatial_tar = 'CytAssist_FFPE_Protein_Expression_Human_Glioblastoma_spatial.tar.gz'

# Local download/ingestion paths/configs:
data_root = 'data'     # Sync 10x Visium spatial data into f"{data_root}/{dataset_name}/10x". By default, spatial SOMA data will be ingested into f"{data_root}/{dataset_name}/soma" as well.
exp_uri = None         # Ingest spatial SOMA data here; defaults to f"{data_root}/{dataset_name}/soma"
scene_name = "scene1"  # Scene name to write, in ingested spatial SOMA
overwrite_10x = False  # If  already exists, remove and re-ingest it
overwrite_exp = False  # If `exp_uri` already exists, remove and re-ingest it
[3]:
# Set default paths
dataset_root = join(data_root, dataset_name)
data_dir_10x = join(dataset_root, '10x')
if exp_uri is None:
    exp_uri = join(dataset_root, 'soma')
exp_uri
[3]:
'data/CytAssist_FFPE_Protein_Expression_Human_Glioblastoma/soma'
[4]:
def sh(*cmd):
    err(f"Running: {shlex.join(cmd)}")
    check_call(cmd)
Download sample data from 10x
This section will download data from 10x and use that data to generate the TileDB-SOMA Experiment with spatial data.
[5]:
if exists(exp_uri):
    if overwrite_exp:
        err(f"Removing {exp_uri}")
        rmtree(exp_uri)
[6]:
paths = {
    filtered_h5: 'filtered_feature_bc_matrix.h5',
    spatial_tar: spatial_tar
}
if exists(exp_uri):
    err(f"{exp_uri} exists; skipping 10x data download")
else:
    for src_name, dst_name in paths.items():
        src = f'{url_base}/{dataset_name}/{src_name}'
        dst = join(data_dir_10x, dst_name)
        if exists(dst):
            if overwrite_10x:
                err(f"{dst} exists, removing")
                remove(dst)
        if not exists(dst):
            makedirs(data_dir_10x, exist_ok=True)
            sh('wget', '-qO', dst, src)
            if dst.endswith('.tar.gz'):
                sh('tar', '-C', data_dir_10x, '-xvf', dst)
data/CytAssist_FFPE_Protein_Expression_Human_Glioblastoma/soma exists; skipping 10x data download
[7]:
if not exists(exp_uri):
    err(f"Ingesting {data_dir_10x} to {exp_uri}")
    from_visium(
        exp_uri,
        input_path=data_dir_10x,
        measurement_name="RNA",
        scene_name=scene_name,
        use_raw_counts=False,
    )
Data access
Spatial SOMA experiments can be acess and queries using any of tiledbsoma’s exsiting APIs.
[8]:
exp = Experiment.open(exp_uri)
exp.spatial
[8]:
<Collection 'file:///home/jules/Software/TileDB-Inc/TileDB-SOMA/apis/python/notebooks/data/CytAssist_FFPE_Protein_Expression_Human_Glioblastoma/soma/spatial' (open for 'r') (1 item)
    'scene1': 'file:///home/jules/Software/TileDB-Inc/TileDB-SOMA/apis/python/notebooks/data/CytAssist_FFPE_Protein_Expression_Human_Glioblastoma/soma/spatial/scene1' (unopened)>
Here, we’re loading the non-spatial elements into memory as a standard AnnData object.
[9]:
adata = tiledbsoma.io.to_anndata(
    experiment=exp,
    measurement_name="RNA",
    X_layer_name="data",
)

adata
/home/jules/.pyenv/versions/3.12.7/envs/soma/lib/python3.12/site-packages/anndata/_core/anndata.py:401: FutureWarning: The dtype argument is deprecated and will be removed in late 2024.
  warnings.warn(
[9]:
AnnData object with n_obs × n_vars = 5756 × 18085
    var: 'gene_ids', 'feature_types', 'genome', 'isotype_control', 'normalized', 'pattern', 'read', 'secondary_name', 'sequence'
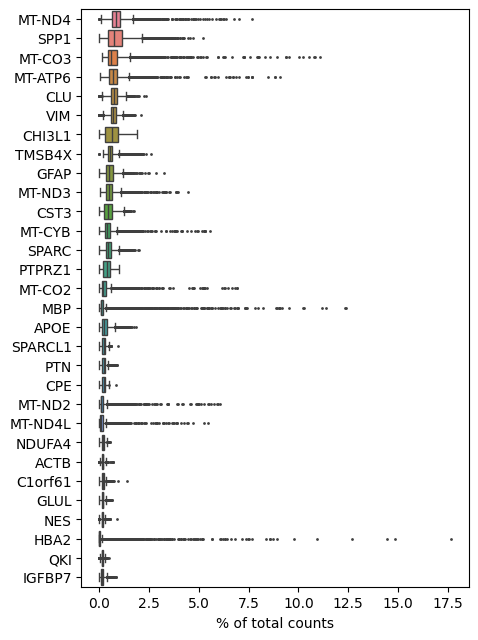
Let’s visualize the most highly expressed genes in the dataset.
[10]:
sc.pl.highest_expr_genes(adata)

Spatial components
The new SOMA Experiment contains spatial data for this experiment stored in the spatial property of the Experiment. If we view the spatial collection we there is only one Scene named scene0.
[11]:
scene = exp.spatial[scene_name]
scene
[11]:
<Scene 'file:///home/jules/Software/TileDB-Inc/TileDB-SOMA/apis/python/notebooks/data/CytAssist_FFPE_Protein_Expression_Human_Glioblastoma/soma/spatial/scene1' (open for 'r') (3 items)
    'img': 'file:///home/jules/Software/TileDB-Inc/TileDB-SOMA/apis/python/notebooks/data/CytAssist_FFPE_Protein_Expression_Human_Glioblastoma/soma/spatial/scene1/img' (unopened)
    'obsl': 'file:///home/jules/Software/TileDB-Inc/TileDB-SOMA/apis/python/notebooks/data/CytAssist_FFPE_Protein_Expression_Human_Glioblastoma/soma/spatial/scene1/obsl' (unopened)
    'varl': 'file:///home/jules/Software/TileDB-Inc/TileDB-SOMA/apis/python/notebooks/data/CytAssist_FFPE_Protein_Expression_Human_Glioblastoma/soma/spatial/scene1/varl' (unopened)>
The scene contains three folders:
img - A SOMA Collection that stores imagery data. In this example it contains an image pyramid for the high- and low-resolution slide.
obsl - A SOMA Collection storing location data in the form of SOMADataFrames defined on the obs somajoinid (or obs_id). In this example, this contains a single dataframe with basic information about the Visium spot locations and sizes.
varl - A collection that stores location data in form form of dataframes defined on the var somajoinid (or var_id). This collection is nested with the first layer mapping from measurement name to a collection storing dataframes. There is no feature spatial data in the Visium example, so this collection is empty.
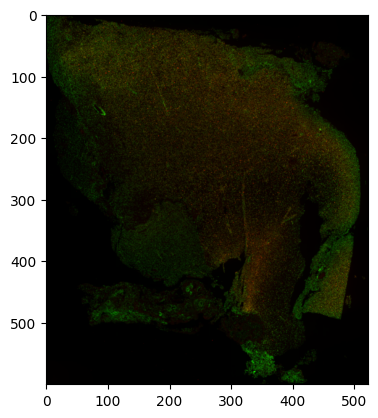
Inside the img collection, there is a Image2DCollection storing the slide images. Here we view basic information about the slide zoom levels and read the data in the hires image.
The scene is defined on a pixel coordinate space.
[12]:
scene.coordinate_space
[12]:
CoordinateSpace(axes=(Axis(name='x', unit='pixels'), Axis(name='y', unit='pixels')))
Images
Inside the img collection, there is a MultiscaleImage storing the slide images. Here we view basic information about the slide zoom levels and read the data in the hires image.
[13]:
tissue_image = scene.img["tissue"]
tissue_image
[13]:
<MultiscaleImage 'file:///home/jules/Software/TileDB-Inc/TileDB-SOMA/apis/python/notebooks/data/CytAssist_FFPE_Protein_Expression_Human_Glioblastoma/soma/spatial/scene1/img/tissue' (open for 'r')>
[14]:
tissue_image.coordinate_space
[14]:
CoordinateSpace(axes=(Axis(name='x', unit='pixels'), Axis(name='y', unit='pixels')))
Use the level_count property to get the number of levels in the MultiscaleImage.
[15]:
tissue_image.level_count
[15]:
2
Examine the metadata for each image level in the “tissue” collection.
[16]:
for level in range(tissue_image.level_count):
    print(f"Level {level} shape: {tissue_image.level_shape(level)}")
Level 0 shape: (3, 2000, 1744)
Level 1 shape: (3, 600, 523)
Accessing individual elements of the MultiscaleImage collection returns a DenseNDArray that can be read using the standard API.
[17]:
lowres = tissue_image["lowres"]
lowres
[17]:
<DenseNDArray 'file:///home/jules/Software/TileDB-Inc/TileDB-SOMA/apis/python/notebooks/data/CytAssist_FFPE_Protein_Expression_Human_Glioblastoma/soma/spatial/scene1/img/tissue/lowres' (open for 'r')>
[18]:
im = lowres.read().to_numpy()
[19]:
im = np.moveaxis(im, 0, -1).astype(np.uint8)  # Move channel axis to final axis for viewing.
plt.imshow(im)
[19]:
<matplotlib.image.AxesImage at 0xff6b402b8560>

Spatial Dataframe
The obsl collection stores location data in the loc dataframe. This dataframes stores the spot locations of the Visium dataset with soma_joinid matching those used in the obs dataframe in the root Experiment.
[20]:
spots_point_cloud = scene.obsl["loc"]
[21]:
spots_point_cloud.coordinate_space
[21]:
CoordinateSpace(axes=(Axis(name='x', unit='pixels'), Axis(name='y', unit='pixels')))
[22]:
spots = spots_point_cloud.read().concat().to_pandas()
spots
[22]:
| x | y | soma_joinid | in_tissue | array_row | array_col | spot_diameter_fullres | |
|---|---|---|---|---|---|---|---|
| 0 | -87 | 3078 | 5436 | 1 | 26 | 182 | 184.593855 |
| 1 | 17 | 680 | 1735 | 1 | 17 | 181 | 184.593855 |
| 2 | 28 | 1212 | 1410 | 1 | 19 | 181 | 184.593855 |
| 3 | 39 | 1745 | 1337 | 1 | 21 | 181 | 184.593855 |
| 4 | 165 | 411 | 166 | 1 | 16 | 180 | 184.593855 |
| ... | ... | ... | ... | ... | ... | ... | ... |
| 5751 | 22616 | 22038 | 4115 | 1 | 99 | 37 | 184.593855 |
| 5752 | 22913 | 21500 | 5220 | 1 | 97 | 35 | 184.593855 |
| 5753 | 23231 | 22026 | 5016 | 1 | 99 | 33 | 184.593855 |
| 5754 | 22638 | 23103 | 2766 | 1 | 103 | 37 | 184.593855 |
| 5755 | 22627 | 22570 | 4910 | 1 | 101 | 37 | 184.593855 |
5756 rows × 7 columns
[23]:
obs_df = exp.obs.read().concat().to_pandas()
obs_df
[23]:
| soma_joinid | obs_id | |
|---|---|---|
| 0 | 0 | AACAATGGAACCACAT-1 |
| 1 | 1 | AACAATGTGCTCCGAG-1 |
| 2 | 2 | AACACCAGCCTACTCG-1 |
| 3 | 3 | AACACCATTCGCATAC-1 |
| 4 | 4 | AACACCGAATGTCTCA-1 |
| ... | ... | ... |
| 5751 | 5751 | TGTTGGCCTGTAGCGG-1 |
| 5752 | 5752 | TGTTGGTGCGCACGAG-1 |
| 5753 | 5753 | TGTTGGTGCGCTTCGC-1 |
| 5754 | 5754 | TGTTGGTGCGGAATCA-1 |
| 5755 | 5755 | TGTTGGTGGACTCAGG-1 |
5756 rows × 2 columns
[24]:
joinid_counts = spots.soma_joinid.value_counts().value_counts()
assert len(joinid_counts) == 1
joinid_counts
[24]:
count
1    5756
Name: count, dtype: int64
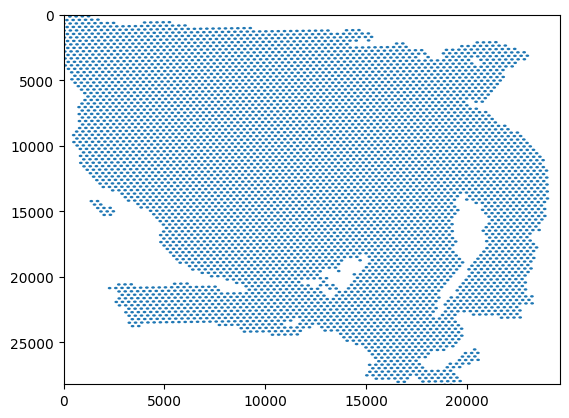
We take the data from the spot dataframe and create a plot showing the regions in the tissue.
[25]:
radius = scene.obsl["loc"].metadata["soma_geometry"]
spot_patches = PatchCollection([
    mplp.Circle((row["x"], row["y"]), radius=radius, color='b')
    for _, row in spots.iterrows()
])
[26]:
fig, ax = plt.subplots()
ax.set_xlim([0, 24592])
ax.set_ylim([0, 28202])
ax.invert_yaxis()
ax.add_collection(spot_patches)
plt.show()

Reading a region using coordinate transforms.
Using Coordinate Spaces and Transforms
Coordinate spaces and coordinate transforms can be used to project both the Visium spots and the same image.
The scene allows us to check the coordinate spaces of individual elements.
[27]:
scene.get_transform_to_multiscale_image("tissue")
[27]:
<ScaleTransform
  input axes: ('x', 'y')
  output axes: ('x', 'y')
  scales: [0.07091737 0.07091696]>
[28]:
scene.get_transform_to_multiscale_image("tissue", level=1)
[28]:
<ScaleTransform
  input axes: ('x', 'y')
  output axes: ('x', 'y')
  scales: [0.02126708 0.02127509]>
[29]:
scene.get_transform_to_point_cloud_dataframe("loc")
[29]:
<IdentityTransform
  input axes: ('x', 'y')
  output axes: ('x', 'y')>
We want to take a piece of the region that both the multiscale image and point cloud are defined on to do the following:
Read the region from the highest resolution level of the multiscale image.
Read the region from the point cloud storing the spot locations.
Use the transformation from the multiscale image to adjust and output of the point cloud and plot the two items together.
[30]:
x_min, x_max = (0, 12000)
y_min, y_max = (14000, 24592)
fullres_region = [x_min, y_min, x_max, y_max]
fullres_to_image = scene.get_transform_to_multiscale_image("tissue")
[31]:
hires_read = tissue_image.read_spatial_region(0,  fullres_region, region_transform=fullres_to_image)
hires_read
[31]:
SpatialRead(data=<pyarrow.Tensor>
type: uint8
shape: (3, 753, 853)
strides: (642309, 853, 1), data_coordinate_space=CoordinateSpace(axes=(Axis(name='x', unit='pixels'), Axis(name='y', unit='pixels'))), output_coordinate_space=CoordinateSpace(axes=(Axis(name='x', unit=None), Axis(name='y', unit=None))), coordinate_transform=<AffineTransform
  input axes: ('x', 'y')
  output axes: ('x', 'y')
  augmented matrix:
    [[1.41009174e+01 0.00000000e+00 0.00000000e+00]
     [0.00000000e+00 1.41010000e+01 1.39881920e+04]
     [0.00000000e+00 0.00000000e+00 1.00000000e+00]]>)
[32]:
hires_read.coordinate_transform.augmented_matrix
[32]:
array([[1.41009174e+01, 0.00000000e+00, 0.00000000e+00],
       [0.00000000e+00, 1.41010000e+01, 1.39881920e+04],
       [0.00000000e+00, 0.00000000e+00, 1.00000000e+00]])
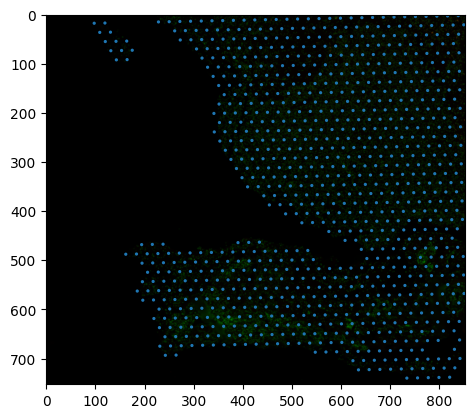
We take the data from the spot dataframe, convert it to the hires resolution, and plot the two images together.
[33]:
point_reader = scene.obsl["loc"].read_spatial_region(fullres_region)
point_reader
[33]:
SpatialRead(data=<tiledbsoma._read_iters.TableReadIter object at 0xff6afc7015e0>, data_coordinate_space=CoordinateSpace(axes=(Axis(name='x', unit='pixels'), Axis(name='y', unit='pixels'))), output_coordinate_space=CoordinateSpace(axes=(Axis(name='x', unit='pixels'), Axis(name='y', unit='pixels'))), coordinate_transform=<IdentityTransform
  input axes: ('x', 'y')
  output axes: ('x', 'y')>)
[34]:
spots = point_reader.data.concat().to_pandas()
spots
[34]:
| x | y | soma_joinid | in_tissue | array_row | array_col | spot_diameter_fullres | |
|---|---|---|---|---|---|---|---|
| 0 | 1683 | 14221 | 1284 | 1 | 68 | 172 | 184.593855 |
| 1 | 1375 | 14227 | 3904 | 1 | 68 | 174 | 184.593855 |
| 2 | 1694 | 14753 | 1442 | 1 | 70 | 172 | 184.593855 |
| 3 | 1842 | 14484 | 3328 | 1 | 69 | 171 | 184.593855 |
| 4 | 2001 | 14747 | 3760 | 1 | 70 | 170 | 184.593855 |
| ... | ... | ... | ... | ... | ... | ... | ... |
| 923 | 11406 | 23069 | 5511 | 1 | 102 | 110 | 184.593855 |
| 924 | 11576 | 23864 | 4769 | 1 | 105 | 109 | 184.593855 |
| 925 | 11713 | 23063 | 5611 | 1 | 102 | 108 | 184.593855 |
| 926 | 11735 | 24127 | 4327 | 1 | 106 | 108 | 184.593855 |
| 927 | 11883 | 23858 | 5166 | 1 | 105 | 107 | 184.593855 |
928 rows × 7 columns
[35]:
spot_to_hires_matrix = hires_read.coordinate_transform.inverse_transform().augmented_matrix
spot_to_hires_matrix
[35]:
array([[ 7.09173715e-02,  0.00000000e+00,  0.00000000e+00],
       [ 0.00000000e+00,  7.09169562e-02, -9.92000000e+02],
       [ 0.00000000e+00,  0.00000000e+00,  1.00000000e+00]])
[36]:
scale_x = spot_to_hires_matrix[0, 0]
scale_y = spot_to_hires_matrix[1, 1]
offset_x = spot_to_hires_matrix[0, 2]
offset_y = spot_to_hires_matrix[1, 2]
[37]:
radius = scene.obsl["loc"].metadata["soma_geometry"]
spot_patches = PatchCollection([
    mplp.Ellipse(
        (scale_x * row["x"] + offset_x, scale_y * row["y"] + offset_y),
        width = radius * scale_x,
        height = radius * scale_y,
        fill=False,
        alpha=0.8,
    )
    for _, row in spots.iterrows()
])
[38]:
fig, ax = plt.subplots()
ax.imshow(np.moveaxis(hires_read.data, 0, -1).astype(np.uint8))
ax.add_collection(spot_patches)

plt.show()

[ ]: